Runtime
Path: ProjectView> double-click Project properties> Properties pane
| Property | Description |
|---|---|
|
Context Menu |
Define how context menu should appear in the HMI project. on delay = context menu appears touching/pressing and holding for a few seconds an empty area of the runtime screen, or via Context menu action on action = context menu appears only via Context menu action. See "ContextMenu" for details. |
|
Developer Tool |
Enable/disables a collection of runtime debugging utility tools. |
| Buzzer on Touch |
Enables buzzer when touching a widget on HMI device screen. Supported widgets:
|
| Buzzer duration | Default 200 ms |
| Keyboard |
Enables the use of keyboard macros at runtime when using external keyboards. |
| JavaScript Debug |
Enables the JavaScript debugger at runtime for the current project. |
| Allow JS Remote Debugger |
Enables JavaScript remote debugger for current project. Remote debugging not supported on HMI Client. |
| Image DB enable |
Activates an engine used by the Runtime to optimize project performance. WARNING: This property should only be disabled by technical support for debugging purposes since this might reduce performance at runtime. |
| FreeType Font Rendering |
Switches to FreeType the font rendering used by JMobile Studio and runtime. The main reason for using the FreeType is that we need the same engine in all devices to avoid different rendering, in particular if static optimization is involved. |
| Communication icon delay (ms) |
Delay before display the communication error icon (default is 0 mSec) The special value -1 is meaning always disabled |
| Fast Boot |
When fast boot is enabled and the User Interface is started before the background server
|
| Waiting period for storage devices |
Set initial waiting period (in seconds) for storage device in case of fastboot In the case of fastboot, the flash is temporarily mounted as read-only and then remounted as read/write at a later time. If you get an error message stating that the storage device is not working properly, you can configure the system to delay this check. The problem can occur occasionally when fastboot is enabled and the device is overloaded with very intense communication. |
Fast Boot
When fast boot is enabled, the HMI device will provide the welcome screen as fast as possible after the power up. In this mode, only the minimum necessary features are loaded before starting the User Interface. Loading of protocols, events, trends, alarms, actions are postponed after loading the User Interface.
There are two flags to set:
-
The “Fast Boot” flag available inside the advanced project properties
- The “Fast Boot” flag available inside the Services page of the BSP System Settings tool (see "System Settings")
When fast boot is enabled and the User Interface is started before the background server the JavaScript event project.onServerReady can be used to get server synchronization.
Example:
if (!project.serverIsReady) {
	// Set the callback to wait for server ready
	project.onServerReady = onServerReady;
} else {
	// Server is ready, call it now
	onServerReady();
}

function onServerReady()
{
	project.setTag("Tag1", 1);
	project.showMessage("Server is ready, tags can be used: " + project.getTag("Tag1") )
}
This is an advance feature available only on Linux platforms
Developer tools
Collection of runtime debugging functions that can be enabled or disabled.
- In Properties pane, set Developer Tools to true.
- Download the project.
- Open context menu.
- Select Developer tools.
Developer tools list
| Tool | Description |
|---|---|
|
Show/Hide all |
Shows a dialog containing information about device status like CPU load, memory usage, event queues. |
|
CPU statistics |
Shows information on CPU load. See "CPU Statistics". |
|
Memory statistics |
Shows information about system RAM . A negative value indicates that free memory is decreasing. |
|
Event queues |
Shows information on event queues (size, maximum achieved size, number of processed events, last and maximum processing time). Timing statistics are only available for non-UI queue. |
|
Timelog summary |
Show page loading time. |
|
Embed window |
Allows embedding in runtime the scene or leave the developer tool window as a standalone window (dialog). |
|
Reset queue stats |
Resets statistical information on event queues. |
|
Disable watchdog |
Disable the watchdog function and prevents system restart in case of freeze or crash of services. |
|
Ignore exceptions |
Disables crash report function, exceptions are not saved in the crash report window. |
|
Profiling |
Measures the time spent for loading/rendering the active page. See "Profiling" |
Watchdog
This feature allows you to disable the watchdog. This way you can avoid system restart in case of a runtime crash and have the time to save the crash report or check system status information (for example,memory available, CPU load, events queue size and so on).
The crash report dialog is displayed automatically in case of a system freeze or crash allowing users to save a log file of crash.
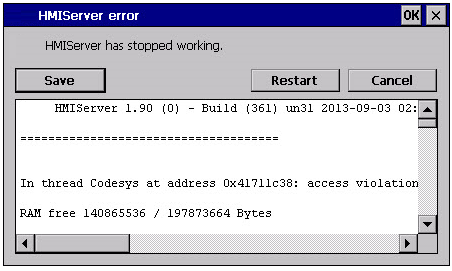
Important: Save this file for technical support.
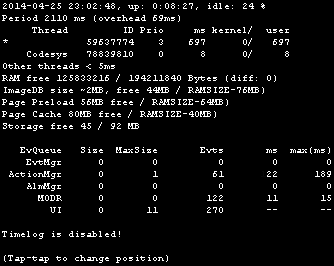
On the top row the current machine time is shown along with the total device uptime.
CPU statistics are collected with a frequency of 2000 milliseconds. The actual period and the overhead required to collect and visualize statistics are displayed as well. The more the actual period is far from the nominal 2000 milliseconds the higher is the system load. CPU consumption of threads is listed reporting the name of the thread (if available, main thread is marked with a *), the thread ID, the thread priority and CPU time spent during the 2000 milliseconds period, divided in user and kernel time.
Profiling allows you to check time spent for loading/rendering the active page. Profiling will start from the next page load and will be active only for the first painting of the page to the screen (the configuration is retained).
| Profiling option | Description |
|---|---|
| Enable timelog | Enable timelog capture. Timing will be visible inside the “Timelog summary” window. |
| Save timelog to file |
Saves a report of profile details and the time spent loading a project and its pages into a timelog.txt file. This file can be exported and shared for further analysis. Important: The execution of this function may reduce page change performance. |
| Overlay OnLoad times Overlay Rendering times |
This view allows displaying time spent on single widgets and is available only for the rendering and OnLoad steps. The view gives an immediate feeling of where time is spent. Red zones represent the most time critical zones. Detailed widget times are visualized by a tooltip window. In case of out-of-the-scene widgets some arrows allow to navigate to these areas and hovering on them the tooltip will show the area summary |
| Select overlay color |
Select the overlay color to use |
| Data | Description |
|---|---|
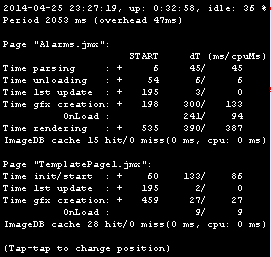
| Time parsing | Time spent parsing current page. Depends on page complexity/number of widgets. |
| Time gfx creation | Time spent for image rendering. Mainly related to the Onload method. |
| Time rendering | Time spent rendering the page. |
| Time unloading | Time spent unloading the page, if current page depends from another page. |
Times are provided in couples: wall time/CPU time. Wall time is the absolute time required by this part which can be higher than the actual CPU time required since higher priority threads are also running (for instance protocols). The start time column refers to the page load start time. It can be used to track the actual time required to load a page, since partial times only refer to the most time critical functions and do not include other times that often contribute significantly to the total time.
For example, the actual total wall time required to load a page is rendering (which is the last step) start time + rendering wall time.
FreeType font rendering
New projects use the FreeType font engine as default. Projects created with older versions of JMobile Studio could use an older font engine also after project conversion to avoid any backward compatibility issue.
Switch to FreeType whenever possible for better page rendering.
Once you have switched to the new font rendering, save the project and verify that all texts are displayed correctly in all project pages.
Font rendering issues
When switching to the FreeType font engine a project created with the older font engine, you may experience the following problems:
- text requires more/less pixels for rendering thus changing text layout
- widgets are resized to accommodate text
- better rendering can be obtained using antialiasing (antialiasing is a text widget property)